MOSAIC
Modern Ocean Sediment Archive and Inventory of Carbon
Excel template Tutorial
MOSAIC is a collaborative database! If you have data (published and unpublished) and would like to contribute, download the Excel template and send it back to mosaic@erdw.ethz.ch. Here we explain how you can fill in the template to contribute your data to MOSAIC.
Workbook structure
The workbook has 4 sheets: ARTICLE_AUTHOR, GEOPOINTS_CORE, SAMPLE_ANALYSES, SET_VARIABLES.

The first three sheets refer to the main data categories that the database stores, in a hierarchical configuration: the source metadata is stored in the ARTICLE_AUTHOR sheet, all the information regarding sampling (e.g., coordinates, sampling date, sampling technique) is stored in GEOPOINTS, and the different analyses performed on the sediment samples are stored in SAMPLE_ANALYSES

In each sheet, the columns that have a darker color are mandatory. If you don’t fill them, the quality check algorithm will raise an error.
ARTICLE_AUTHOR
Provide information about the source of the data. If you have a DOI, provide it, since it will allow the quality check and population algorithms to extract all the metadata from that source. The information of the title and author will be asked for in the SAMPLE_ANALYSES sheet.
GEOPOINTS_CORES
Provide information about the sediment sampling. Columns in dark green are required, and the remaining columns are complimentary.
- Core_name: unique name of the retrieved sediment sample.
Note that the core_name needs to be unique for indexing purposes. If you have two cores with the same name, modify their names so that they are unique (e.g., add the sampling year or month, name of cruise, etc.) - Latitude and Longitude: should be provided in WGS 84 Decimal Degrees (DD).
- Georeferenced_coordinates: Defines whether the coordinates were obtained by georeferencing a map or from the source (i.e., in the field).
SAMPLE_ANALYSES
Provide information about the analyses performed on the samples. Columns in dark red are mandatory, and the remaining columns are complementary.
- Geopoint Data: entry_user_name, core_name, sample_name.
Choose from the drop-down menu the core_name that you previously specified in GEOPOINTS_CORES. This is why the core_name needs to be unique! The sample_name doesn’t need to be unique. - Article / Author that provided data: exclusivity_clause, title, author_firstname, author_lastname.
Choose from the drop-down menu the title and author name that you previously specified in ARTICLE_AUTHOR. This will link the information you provide in this sheet to the appropriate reference.

- Section of sample in the core: sample_depth_upper_cm, sample_depth_bottom_cm, sample_depth_average_cm
Provide the upper and bottom sample section slice of the core (sample_depth_upper_cm, sample_depth_bottom_cm) and/or the average section depth (sample_depth_average_cm). Provide as much information as possible.
Some studies only report that they sample surface sediment without specifying which sampling sectioning they performed (0-0.5 cm, 0-1 cm, 0-2 cm). In these situations, put 0 in sample_depth_average_cm, and you can even specify this under sample_comments. If you have any additional information to share about the sample section, add it under sample_comment.

Adding sample analyses
Given the complexity of the database, the data columns are dynamic. You can modify the column names based on the analyses that you have available. For example:

The first row (Sample analysis category) lets you choose the category of the sample analysis: sample_composition (OC, TN, OC:TN ratio, TIC, CaCO3), sample_sediment_properties (dry bulk density, grain size, water content, porosity, surface area), sample_isotopes (δ13C, δ15N, δ18O). You can find the full list in the SET_VARIABLES sheet, if needed.
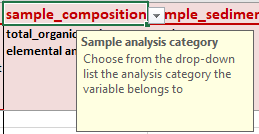
The second row (Sample analysis) lets you choose the analysis you performed based on the category you defined in the previous row. You can see below that depending on the variable category, different variables are displayed:


The third row (Method) lets you choose the method category used to analyse this parameter. You can see below that depending on the analysis, different methods are displayed:


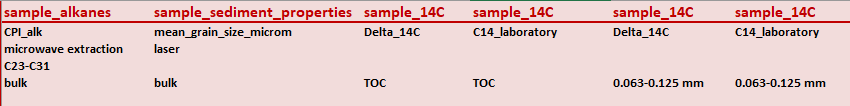
Since the method categories do not allow you to provide details about the method employed, the fourth row (Method details) provides you with a space to add a free-text with additional information, such as the model’s equipment employed, or pre-treatment used. In the case of biomarkers, we encourage you to specify which compounds were analyzed, as shown below:

The fifth row (Material analyzed) lets you choose if the analysis was performed on bulk sediment, TOC, or which sediment or molecular fraction was analyzed. You can see below some common examples:
The sixth_row (Reported/calculated data) lets you specify whether the data you provide was reported in the study/repository or if you calculated from other parameters.
Note: You can have duplicate columns with the same analysis, as long as the method employed, material_analyzed, or reported/calculated field is different, as shown above.
Here you can download an example of a filled-in Excel input file